Temperature
July has the warmest monthly average (27.8°C); January is coolest (-2.3°C). These averages include nights, so daytime highs can be considerably warmer.

China · Visit or make it home
Zibo is a city in China. Compare its dated local facts and monthly climate before choosing a time to visit or planning a move. Housing references and national earnings describe different populations; verify the costs of your own home and job before deciding.
Get to know Zibo
Zibo is a prefecture-level city in central Shandong province, China. It borders the provincial capital Jinan to the west, Tai'an to the southwest, Linyi to the south, Weifang to the east, Dongying to the northeast, and Binzhou to the north. Zibo spans 5,938 square kilometres . As of the 2020 census, Zibo's population was 4,704,138, of which 4.41 million lived in the metro area comprising five urban districts—Zhangdian, Zichuan, Boshan, Zhoucun and Linzi–and parts of neighboring counties Huantai, Gaoqing, and Yiyuan. The Zibo area was the centre of the ancient State of Qi, whose capital Linzi was the most populous city in China at its peak. Pu Songling, a well-known writer of the Qing dynasty, is one of the most famous people from Zibo. As the birthplace of Qi culture, Zibo is a notable tourist city. Manufacturing holds an important place of the city's economy, particularly ceramics manufacturing. Other key industries include the petrochemical industry, pharmaceuticals, metallurgy, construction materials, machinery and textiles.
Weather through the year
July has the warmest monthly average (27.8°C); January is coolest (-2.3°C). These averages include nights, so daytime highs can be considerably warmer.
July averages about 165 mm of rain, compared with 6 mm in January. For an outdoor-focused trip, compare the drier months before choosing dates.
April, May, September, October combine monthly mean temperatures of 12–22°C with less than 100 mm of precipitation. These are useful dates to compare for a walking-focused visit; check daylight, opening times and the forecast for your actual trip.
Monthly mean temperatures reach at least 25°C in June, July, August. For sightseeing, plan shade, water breaks and accommodation cooling into your day; daytime temperatures can be higher than these day-and-night averages.
January, February, December have monthly means below 5°C. For a stay then, compare accommodation heating and keep indoor options in your itinerary. These figures do not establish snow cover or ski conditions.
| Month | Jan | Feb | Mar | Apr | May | Jun | Jul | Aug | Sep | Oct | Nov | Dec |
|---|---|---|---|---|---|---|---|---|---|---|---|---|
| Average °C | -2.3 | 0.7 | 7.1 | 14.5 | 21.4 | 26.3 | 27.8 | 25.9 | 21.4 | 14.7 | 6.2 | -0.8 |
| Rain, mm | 6 | 13 | 11 | 34 | 55 | 84 | 165 | 162 | 56 | 22 | 25 | 9 |
Source: NASA POWER climatology · Reference period: 2001-2020. Long-term averages for the surrounding grid area. Conditions vary within a city; monthly averages are neither a forecast nor a guarantee of dry days.
Build your shortlist for a day out. Distances are straight-line from the city centre; check routes and opening times before setting off.
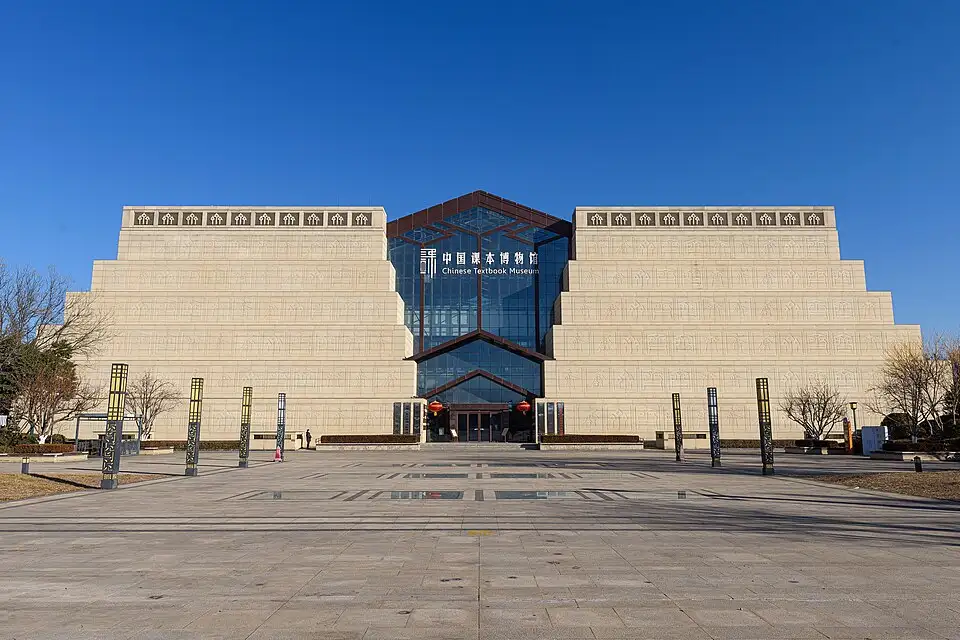
Museum
2.3 km from the city centre
Compare with another cityPark
2.4 km from the city centre
Compare with another cityA verified average rent for Zibo is not available in the evidence shown here. Do not substitute another city’s price or a national estimate. Compare current properties for the same home size and neighbourhood, then include utilities, deposits and daily transport when building a budget for a visit or move.
A verified city average salary for Zibo is not available in the evidence shown here. National income per person and purchasing-power measures are not salaries and cannot predict take-home pay. Compare a current offer in your occupation with local taxes, housing and transport costs before deciding whether a move is affordable.
Compare the same dated measures for both cities, keeping local observations separate from national context. Start with rent, your expected income and the journeys you will make regularly. Then adjust the comparison weights to your priorities. Missing measurements do not prove an advantage; verify decisive costs and services with current local sources.
Data sources, licences & reuse terms
Plan your stay
Compare accommodation for your actual dates in Zibo, then add the journey here, airport transfers, meals and the activities you want. A cheap room outside the centre can cost more overall if it adds daily transport.
Compare holiday preferences →Use the planner below to compare housing, daily spending and the cost of your move.
Include the deposit, utilities, internet and commuting. Compare those costs with your own expected take-home income.
Compare with another city →Build a monthly budget for Zibo in euros. Totals are calculated from the amounts below, not live quotes. Enter a housing amount for your chosen home.
Monthly total:
First month including move:
Compare with another city →Compare the details
3.9 kWh/m²/day
Data period: 2001-2020. Source: NASA POWER — climatology (T2M temperature; PRECTOTCORR precipitation) · NASA scientific-data policy; source-specific notices applyCompare with another city →642 mm/year
Annual precipitation gives a broad climate comparison. Its distribution through the year matters more for a short visit.
Data period: 2001-2020. Source: NASA POWER — climatology (T2M temperature; PRECTOTCORR precipitation) · NASA scientific-data policy; source-specific notices applyCompare with another city →3.7 m/s
Data period: 2001-2020. Source: NASA POWER — climatology (T2M temperature; PRECTOTCORR precipitation) · NASA scientific-data policy; source-specific notices applyCompare with another city →4,704,138 people
Population helps compare the scale of a destination. Administrative boundaries differ, so it is not always the population of the whole metropolitan area.
Data period: 2026-09-20. Source: GeoNames geographical database — global city identity fallback · CC BY 4.0Compare with another city →13.6 °C
Long-term average including days and nights. Use the monthly breakdown to choose dates; this is not a weather forecast.
Data period: 2001-2020. Source: NASA POWER — climatology (T2M temperature; PRECTOTCORR precipitation) · NASA scientific-data policy; source-specific notices applyCompare with another city →75.8 km
Straight-line distance to a listed airport, not transfer time or confirmation of scheduled flights. Check the airport serving your actual route before booking.
Data period: 2026-08-30. Source: OurAirports — airport locations · Public domainCompare with another city →30.1 °C
Data period: 2001-2020. Source: NASA POWER — climatology (T2M temperature; PRECTOTCORR precipitation) · NASA scientific-data policy; source-specific notices applyCompare with another city →These are country-level figures, not measurements of Zibo. Use them to compare national conditions; neighbourhoods, salaries and individual services can differ substantially.
29,160 international dollars (PPP)
Purchasing-power-adjusted national income per person is not a salary or take-home pay.
Data period: 2025. Source: World Bank — GNI per capita, PPP (NY.GNP.PCAP.PP.CD) · CC BY 4.0 with World Bank additional termsCompare with another city →91.6 percent
Data period: 2025. Source: World Bank / ITU — Individuals using the Internet, % (IT.NET.USER.ZS) · CC BY 4.0 with World Bank additional termsCompare with another city →78 years
Life expectancy describes population health outcomes; it does not measure the quality or availability of a particular hospital.
Data period: 2024. Source: World Bank — Life expectancy at birth (SP.DYN.LE00.IN) · CC BY 4.0 with World Bank additional termsCompare with another city →40 ordinal_0_100
Data period: 2026-08-30. Limited confidence. Source: Wikidata — coordinates, population, timezone, ISO codes, official languages · CC0 1.0Compare with another city →7 percent_gdp
Taxes and social contributions as a share of the economy, not your personal income-tax rate.
Data period: 2024. Source: World Bank — Tax revenue % of GDP (GC.TAX.TOTL.GD.ZS) · CC BY 4.0 with World Bank additional termsCompare with another city →0.5 per 100,000 people
Homicide rates are a narrow safety indicator. They do not describe petty crime or the safety of an individual neighbourhood.
Data period: 2020. Source: World Bank / UNODC — Intentional homicides per 100k (VC.IHR.PSRC.P5) · CC BY 4.0 with World Bank additional termsCompare with another city →63.9 (EU average = 100)
Data period: 2025. Limited confidence. Source: World Bank — Price level index, household consumption (PA.NUS.PRVT.PLI) · CC BY 4.0 with World Bank additional termsCompare with another city →32 µg/m³
Data period: 2023. Limited confidence. Source: World Bank — PM2.5 mean annual exposure (EN.ATM.PM25.MC.M3) · CC BY 4.0 with World Bank additional termsCompare with another city →127.5 points (0–188)
Data period: 2025. Estimate. Source: World Bank HCI+ education pillar (2025) · CC BY 4.0 with World Bank additional termsCompare with another city →About 93 km from Zibo in a straight line. Compare seasonal weather and local facts.
About 96 km from Zibo in a straight line. Compare seasonal weather and local facts.
About 222 km from Zibo in a straight line. Compare seasonal weather and local facts.
About 273 km from Zibo in a straight line. Compare seasonal weather and local facts.
Read the source dates, choose your priorities and keep unavailable values separate from costs you know.
All maintained comparisons →