Majuro →
Compare Majuro for seasonal weather, housing and everyday journeys. Open its guide for the local introduction, monthly climate and sources.

Explore the country
Marshall Islands provides national context for a visit or move. Read its sourced introduction and dated national indicators, then compare individual cities for seasonal weather, housing and daily journeys. National averages cannot establish the costs, services or conditions of a particular neighbourhood.
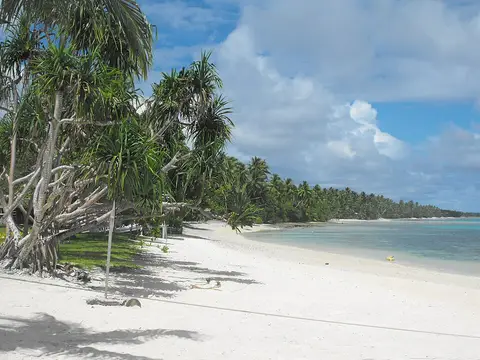
Compare relocation preferencesThe Marshall Islands, officially the Republic of the Marshall Islands, is an archipelagic country in Oceania. The sovereign state lies west of the International Date Line and north of the equator in the Micronesia region of the Northwestern Pacific Ocean. The islands consist of 29 coral atolls, five main islands, and 1,220 other very small ones, divided across two island chains: Ratak in the east and Ralik in the west. Its capital and largest city is Majuro, home to approximately half of the country's population, and 98.47% of its territory is lagoon waters, the largest proportion of water to land of any sovereign state. One of only four atoll-based nations along with Kiribati, The Maldives, and Tuvalu, the country shares maritime boundaries with Wake Island to the north, Kiribati to the southeast, Nauru to the south, and the Federated States of Micronesia to the west. The Marshall Islands has one of the world’s highest rates of diabetes. In Ebeye, the country's second most populated island, over 33% of residents have the disease.
Compare Majuro for seasonal weather, housing and everyday journeys. Open its guide for the local introduction, monthly climate and sources.
National averages are a starting point, not a neighbourhood budget. Shortlist specific places in Marshall Islands, compare housing for your dates and check the journey to work, school or the activities that matter to you.
For a move, confirm residence and work requirements with the relevant government authority for your nationality. For a holiday, compare transport, accommodation and daily spending separately.
These figures describe Marshall Islands as a whole. Check the dates when comparing these national indicators with current local conditions.
4.1 µg/m³
Data period: 2023. Limited confidence. Source: World Bank — PM2.5 mean annual exposure (EN.ATM.PM25.MC.M3) · CC BY 4.0 with World Bank additional termsCompare with another city →4.2 per 100,000 people
Homicide rates are a narrow safety indicator. They do not describe petty crime or the safety of an individual neighbourhood.
Data period: 1994. Older figure — excluded from recommendations. Limited confidence. Source: World Bank / UNODC — Intentional homicides per 100k (VC.IHR.PSRC.P5) · CC BY 4.0 with World Bank additional termsCompare with another city →10,590 international dollars (PPP)
Purchasing-power-adjusted national income per person is not a salary or take-home pay.
Data period: 2025. Source: World Bank — GNI per capita, PPP (NY.GNP.PCAP.PP.CD) · CC BY 4.0 with World Bank additional termsCompare with another city →65.9 percent
Data period: 2024. Source: World Bank / ITU — Individuals using the Internet, % (IT.NET.USER.ZS) · CC BY 4.0 with World Bank additional termsCompare with another city →67.1 years
Life expectancy describes population health outcomes; it does not measure the quality or availability of a particular hospital.
Data period: 2024. Source: World Bank — Life expectancy at birth (SP.DYN.LE00.IN) · CC BY 4.0 with World Bank additional termsCompare with another city →17.2 percent_gdp
Taxes and social contributions as a share of the economy, not your personal income-tax rate.
Data period: 2020. Limited confidence. Source: World Bank — Tax revenue % of GDP (GC.TAX.TOTL.GD.ZS) · CC BY 4.0 with World Bank additional termsCompare with another city →100 ordinal_0_100
Data period: 2026-08-30. Source: Wikidata — coordinates, population, timezone, ISO codes, official languages · CC0 1.0Compare with another city →126.4 (EU average = 100)
Data period: 2021. Limited confidence. Source: World Bank — Price level index, household consumption (PA.NUS.PRVT.PLI) · CC BY 4.0 with World Bank additional termsCompare with another city →88.8 points (0–188)
Data period: 2025. Estimate. Source: World Bank HCI+ education pillar (2025) · CC BY 4.0 with World Bank additional termsCompare with another city →